
Introduction
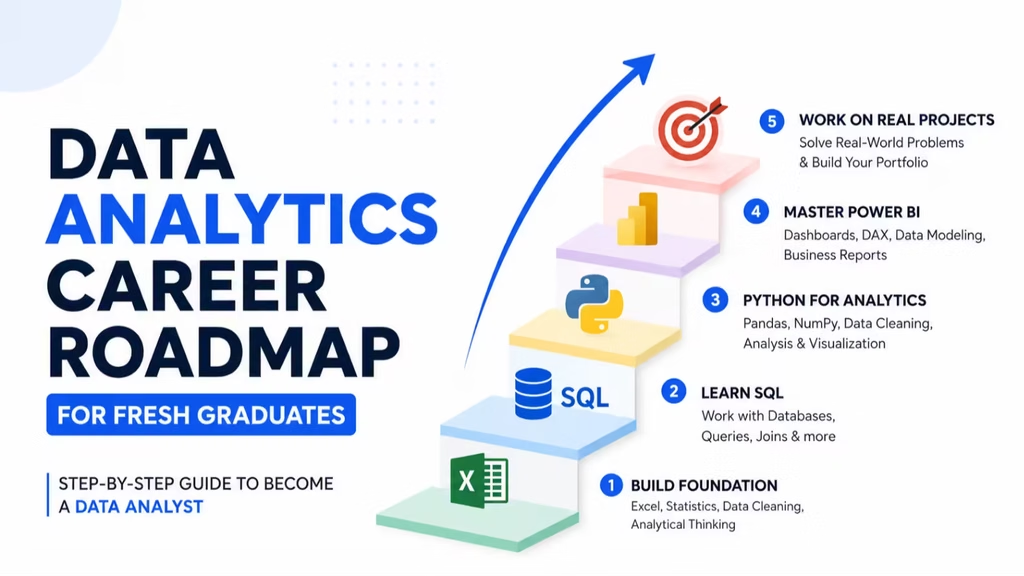
A data analytics roadmap is a step-by-step plan that shows you what to learn, in what order, to become a data analyst. If you are a fresher, this plan can save you months of confusion.
Many beginners start with random YouTube videos. They learn Python today, Tableau tomorrow, and machine learning next week. After three months, they know a little about everything and cannot do a real job task.
This data analytics roadmap for freshers fixes that problem. It tells you exactly what to learn first, what to skip for now, and how to get your first job.
In this blog, you will learn:
- What data analytics means, in simple words
- The 8 steps of the data analytics roadmap
- Which data analytics skills and tools matter most
- Easy data analytics projects for your portfolio
- A clear 90-day plan to get started
Data Analytics
Definition: Data analytics is the process of collecting, cleaning, and studying data to find useful patterns and help people make better decisions.
In simple words, data analytics means turning numbers into answers. For example, a shop owner wants to know, “Which product sells the most in December?” A data analyst looks at the sales data and gives the answer.
Where data analytics is used:
- Retail: sales and customer trends
- Banking: risk and fraud checks
- Healthcare: patient and hospital data
- IT and SAP companies: business reports
- Marketing: campaign results
Why Choose a Data Analytics Career?
Definition: A data analytics career is a professional path where you use data to solve business problems, starting from junior analyst roles and growing into senior roles.
Why freshers choose it:
- Every company needs data analysts
- You can start without a coding background
- You can learn the basics in 3 to 4 months
- Non-IT students can also enter
- You can grow into senior analyst, manager, or data scientist roles
If you are confused between roles, read our guide on data analyst vs data scientist (add internal link here).
Data Analytics Roadmap at a Glance
| Step | What to Learn | Time Needed |
|---|---|---|
| Step 1 | Data basics and statistics | 1 to 2 weeks |
| Step 2 | Excel | 3 to 4 weeks |
| Step 3 | SQL | 3 to 4 weeks |
| Step 4 | Power BI | 3 to 4 weeks |
| Step 5 | Python basics | 3 to 4 weeks |
| Step 6 | Data analytics projects | 3 to 4 weeks |
| Step 7 | Portfolio and resume | 1 to 2 weeks |
| Step 8 | Job applications and interviews | Ongoing |
Don’t worry about the total time. Many steps can overlap, and the 90-day plan below shows how.
Step 1: Learn Data Basics and Statistics
Before tools, understand the basics. You don’t need advanced math.
What to learn:
- Types of data (numbers, text, dates)
- Rows, columns, and tables
- Average, median, and percentage
- Minimum, maximum, and range
- Simple charts: bar, line, and pie
Tip: Spend only 1 to 2 weeks here. Basic statistics is enough to start.
Step 2: Learn Excel
Definition: Excel is a spreadsheet tool used to store, clean, calculate, and analyze data in rows and columns.
Excel is the easiest tool in the data analytics roadmap. Almost every company uses it, so it is the best place to start.
Excel skills to learn:
- Basic formulas: SUM, AVERAGE, COUNT, IF
- Lookup formulas: XLOOKUP and VLOOKUP
- Pivot tables and pivot charts
- Data cleaning: remove duplicates, fix text, split columns
- Charts and simple dashboards
Goal: Take a messy sales file, clean it, and build a summary report.
Step 3: Learn SQL
Definition: SQL, which means Structured Query Language, is a language used to get, filter, and manage data stored in databases.
SQL is the most important skill for every data analyst. Most company data is stored in databases, and SQL is how you get it out.
SQL topics to learn:
- SELECT, WHERE, and ORDER BY
- GROUP BY and HAVING
- JOINs (inner, left, right)
- Aggregate functions: COUNT, SUM, AVG
- Subqueries and basic window functions
Goal: Answer business questions like “Which city had the highest sales last month?” using SQL.
Step 4: Learn Power BI
Definition: Power BI is a business intelligence tool from Microsoft that turns data into interactive charts, reports, and dashboards.
After Excel and SQL, Power BI is the fastest way to show your work in a professional way. Managers love dashboards, and recruiters love seeing them in your portfolio.
Power BI topics to learn:
- Importing and cleaning data
- Basic data modeling
- Simple DAX formulas
- Charts, slicers, and filters
- Building and publishing dashboards
Goal: Build one clean sales dashboard that a manager can understand in 30 seconds.
Step 5: Learn Python Basics
Definition: Python is a popular programming language used for data cleaning, analysis, automation, and machine learning.
Python is not always required for a fresher data analyst job, but it gives you a big advantage. Learn only the basics at this stage.
Python topics to learn:
- Variables, lists, and loops
- Pandas for working with tables
- NumPy for calculations
- Matplotlib or Seaborn for charts
- Reading Excel and CSV files
Tip: Don’t try to learn machine learning now. Strong basics come first.
Step 6: Build Data Analytics Projects
Definition: Data analytics projects are real or practice tasks where you collect data, clean it, analyze it, and share the results.
Projects prove that you can do the work. Recruiters trust projects more than certificates.
Easy data analytics projects for freshers:
- Sales dashboard in Power BI
- Employee attrition analysis in Excel
- Customer data cleaning using SQL
- Movie or Netflix data analysis in Python
- Covid or weather data trends
How to do each project:
- Pick a free dataset (Kaggle is a good place)
- Ask 3 to 5 business questions
- Clean and analyze the data
- Build charts or a dashboard
- Write a short summary of your findings
Step 7: Build Your Data Analyst Portfolio
Definition: A data analyst portfolio is a collection of your best projects that shows your skills to employers.
What to include:
- 3 to 5 strong projects
- A short problem statement for each project
- Screenshots of dashboards and charts
- Links to GitHub, Power BI, or Kaggle
- A clear and simple summary of your findings
Where to share it:
- GitHub
- A simple personal website
Step 8: Apply for Jobs and Prepare for Interviews
Job titles to search:
- Junior Data Analyst
- Business Analyst
- Reporting Analyst
- MIS Executive
- Power BI Developer
Interview topics to prepare:
- Excel formulas and pivot tables
- SQL queries and JOINs
- Explaining your projects step by step
- Basic statistics questions
- Simple case studies
Tip: Apply daily, even if you feel you are not 100% ready. Every interview is practice.
Data Analytics Skills You Need
Definition: Data analytics skills are the technical and soft abilities needed to collect, analyze, and explain data.
Technical skills:
- Excel
- SQL
- Power BI or Tableau
- Python basics
- Basic statistics
Soft skills:
- Clear communication
- Problem solving
- Storytelling with data
- Attention to detail
- Curiosity
Technical skills get you the interview. Soft skills help you get the job and grow in it.
90-Day Data Analytics Roadmap
| Month | Focus | Goal |
|---|---|---|
| Month 1 | Data basics, statistics, Excel | Clean data and build pivot reports |
| Month 2 | SQL and Power BI | Write queries and build 1 dashboard |
| Month 3 | Python basics, projects, portfolio | Finish 3 projects and start applying |
Daily routine (2 hours):
- 1 hour learning
- 45 minutes practice
- 15 minutes notes or LinkedIn post
Common Mistakes to Avoid
- Don’t learn too many tools at the same time
- Don’t skip SQL, it is the most important skill
- Don’t depend only on certificates, build projects
- Don’t copy projects without understanding them
- Don’t wait to feel “ready” before applying for jobs
- Don’t ignore communication skills
Frequently Asked Questions (FAQs)
What is the best data analytics roadmap for freshers?
Start with Excel, then SQL, then Power BI, then Python basics. After that, build 3 to 5 projects and create a portfolio.
How long does it take to become a data analyst?
With daily practice, most freshers become job-ready in 3 to 6 months.
Do I need coding for data analytics?
Basic SQL is needed. Python is helpful but not always required for entry-level jobs.
Can a non-IT student become a data analyst?
Yes. Many data analysts come from commerce, arts, and science backgrounds. Start with Excel and build step by step.
Which tool should I learn first in data analytics?
Excel. It is easy, it is used everywhere, and it builds a strong base for SQL and Power BI.
Is data analytics a good career for freshers?
Yes. Demand is high, entry is easier than data science, and you can grow into senior or data scientist roles later.
What projects should I add to my data analyst portfolio?
Add a sales dashboard, a data cleaning project, and one analysis in Python or SQL.
Conclusion
A clear data analytics roadmap makes your journey much easier. You don’t need a big degree or advanced math to begin. You need the right order of learning and daily practice.
To build a stronger theoretical base, you can read about foundational data analysis methods and standard practices on Wikipedia.
Keep reading

Insights
Top IT Skills to Learn in 2027 for High-Paying Jobs
Introduction Top IT skills to learn in 2027 is one of the most common questions among freshers and working professionals who want a high-paying IT job. There are…
Insights
Data Analyst vs Data Scientist: Which Career Is Right for You?
Introduction Data analyst vs data scientist is the first question most beginners ask when they want to enter the data field. Both jobs use data. Both are in…